Students get through the TN Board 12th Economics Important Questions Chapter 12 Introduction to Statistical Methods and Econometrics which is useful for their exam preparation.
TN State Board 12th Economics Important Questions Chapter 12 Introduction to Statistical Methods and Econometrics
Very short answer questions
Question 1.
What is quantitative data?
Answer:
The data are quantified on definite units of measurements.
Question 2.
What do you mean by standard deviations?
Answer:
It is the positive square root of the mean of squared deviations from the mean.
Question 3.
What is dispersion?
Answer:
Dispersion is the extent to which values in a distribution differ from the average of the distribution.
![]()
Question 4.
Write the formulas of (i) Arithmetic mean of ungrouped data (Direct Method) and (ii) Assumed mean.
Answer:
(i) Arithmetic mean = \(\overline{\mathbf{X}}=\frac{\sum x}{N}\)
(ii) Assumed mean = \(\overline{\mathbf{X}}=\mathbf{A}+\frac{\Sigma d}{\mathbf{N}}\)
Question 5.
Calculate Arithmetic mean from the data showing marks of students in a class in an economics test (5 students) (40,50,55,78,58) marks.
Answer:
![]()
The average mark of a student on the economics test is 56.2
Question 6.
What are the types of correlation?
Answer:
Correlation is commonly classified into negative and positive correlation’
Question 7.
What is the measure of dispersion?
Answer:
- Absolute measures of dispersion
- Relative measures of dispersion
Question 8.
Name the methods of studying correlation.
Answer:
- Scatter diagram method
- Graphic method
- Karl Pearson coefficient of correlation.
- Method of least squares
Question 9.
What do you mean by partial correlation?
Answer:
When there are more than two variables and if only two variables are considered keeping the other things constant, then it is known as partial correlation.
![]()
Question 10.
What do you mean by scattering diagram?
Answer:
It is a graph observed by plotted points when each point will represent the value of X and Y.
Short answer questions
Question 1.
Write a note on Standard deviation.
Answer:
The measures of central tendency, serve to locate the center of the distribution, but they don’t reveal how the items are spread out on either side of the center. Standard deviation is one of the methods of Absolute measure of dispersion. It is denoted as a (sigma). There are two methods of calculation of Standard deviation.
(i) Deviations took from Actual mean
(ii) Deviations took from Assumed mean
Question 2.
How to calculate the standard deviation. Explain.
Answer:
Standard deviation = 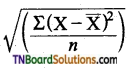
Where \(\overline{\mathrm{X}}\) = Mean value of distribution
n = number of observations
Steps:
(i) Find out the actual mean‘of the given data ( \(\overline{\mathrm{X}}\) )
(ii) Find out deviation of each value from the mean (x = X – \(\overline{\mathrm{X}}\))
(Hi) Square the deviations and Take total of squared deviations ∑ x2.
(iv) Divided the total ∑ x2 by number of observation \(\left(\frac{\Sigma x^{2}}{n}\right)\)
(v) The square root of \(\left(\frac{\Sigma x^{2}}{n}\right)\) is standard deviation.
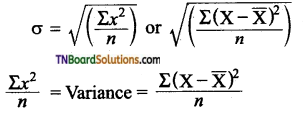
When the size of the sample is less than 30
then variance = 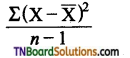
n = number of observation
![]()
Question 3.
Calculate the Standard deviation of the following value 5,10, 25,30,50.
Answer:
The formula is 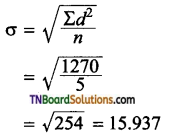
Question 4.
Scatter Diagram – Explain with diagram.
Answer:
Let (X1, Y1), (X2, Y2) (Xn, Yn) be the N pairs of observation of the variables X and Y. If we plot the values of X along the X-axis and the corresponding values of Y along the Y-axis, the diagram obtained is called a Scatter Diagram.
The type of Scatter diagram under a simple linear is given below.
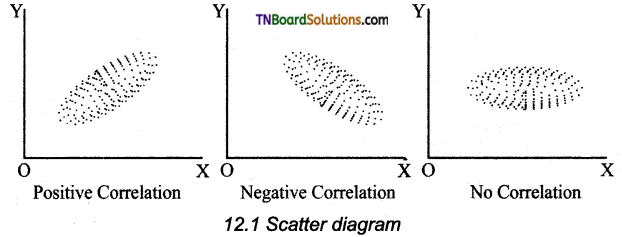
- If the plotted points show an upward trend, correlation is position.
- If the plotted points show a downward trend, the correlation is Negative.
- If the plotted points show no trend, the variable is said to be uncorrelated.
![]()
Question 5.
National Sample Survey Organisation – Explain. (NSSO)
Answer:
This is also known as National Sample Survey Office where is an organization under the ministry of statistics of the Government of India conducting SocioEconomic surveys. It was established in 1950.
There is four divisions.
- Survey Design and Research Division (SDRD)
- Field Operations Division (FOD)
- Data Processing Division (DPD)
- Co-ordination and Publication Division (CPD).
Long answer questions
Question 1.
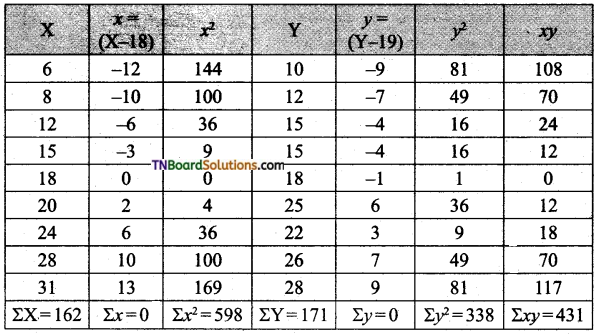
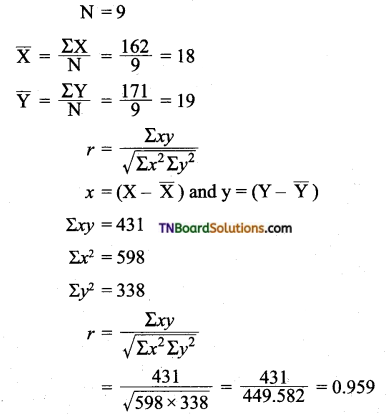
Calculate Karl Pearson’s coefficient of correlation from the following data.
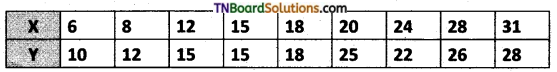
Answer:
![]()
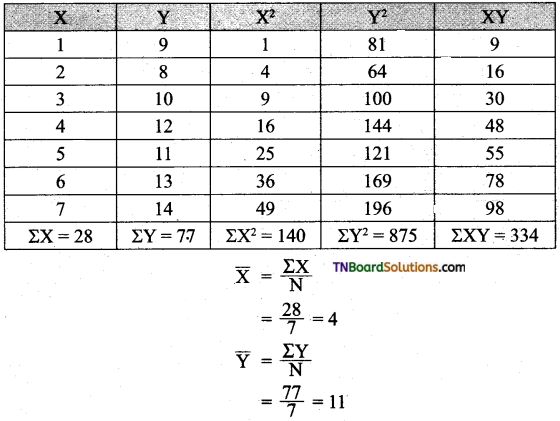
Question 2.
Calculate the regression coefficient and obtain the lines of regression for the following data.
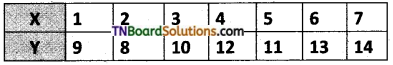
Answer:
Regression coefficient of X on Y
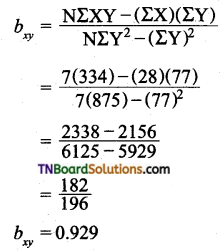
(i) Regression Equation X on Y
X – \(\overline{\mathrm{X}}\) = bxy (Y – \(\overline{\mathrm{Y}}\))
X – 4 = 0.929 (Y-11)
X – 4 = 0.929Y – 10.219
So the regression equation X on Y is
X = 0.929Y – 6.219
X = 0.929 – 6.219
![]()
(ii) Regression co-efficient of Y on X
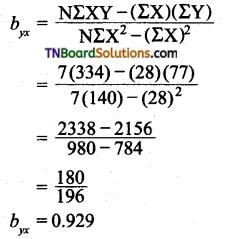
(iii) Regression equation of Y on X
Y – \(\overline{\mathrm{Y}}\) = byx (X – \(\overline{\mathrm{X}}\))
Y – 11 = 0.929 (X – 4)
Y = 0.929 X – 3.716 + 11 .
Y = 0.929 X + 7.284
The Regression Equation of Y on X is
Y = 0.929X +7.284
Activity
Question 1.
Check, Count, and make a data set of the number of pages of your subject books of Economics, Commerce, History, Tamil, and English.
Answer:
Students would be benefited from the Activity, They will gain knowledge and will help them in various ways.
They are:
- Helps to know about facts or the number of pages needed and available.
- Helps to know the Quantified data for a definite unit of measurement.
- Helps to refer to Qualitative characteristics of a subject.
- Helps to know about the subject and the needed hours of study.
- Help the on to Evaluate, understand and work on their daily Assignments.
![]()
Multiple choice questions
1. The first book to have statistics as its title was “contributions to vital statistics” by …………. in 1845.
(a) Adam smith
(b) Ronald fisher
(c) Francis GP Nelson
(d) Robbinson
Answer:
(c) Francis GP Nelson
2. Evidence from history proved that during the reign of ………… vital statistics existed.
(a) Asoka
(b) Kumara Gupta
(c) Chandra Gupta Maurya
(d) Chera
Answer:
(c) Chandra Gupta Maurya
3. In the modern world, it can be termed as;
(a) World of planning
(b) World of maths
(c) World of animals
(d) World of pictures
Answer:
(a) World of planning
![]()
4. ………… is the information about facts or numbers collected.
(a) Statistics
(b) Economics
(c) Data
(d) Econometrics
Answer:
(c) Data
5. Statistics is a branch of:
(a) Commerce
(b) Economics
(c) Maths
(d) Accounts
Answer:
(c) Maths
6. The Latin word ‘status’ represents:
(a) Logic
(b) Science
(c) Economics
(d) Statistics
Answer:
(d) Statistics
7. Quantitative data deal with:
(a) History
(b) Numbers
(c) Raw data
(d) Non-numeric values
Answer:
(d) Non-numeric values
8. Grouped data can be classified into:
(a) 4
(b) 2
(c) 3
(d) 5
Answer:
(b) 2
![]()
9. Sources of data collected for the first time is known as:
(a) Secondary data
(b) Quantitative data
(c) Primary data
(d) Qualitative data
Answer:
(c) Primary data
10. The published data are called as:
(a) Secondary
(b) Primary
(c) Raw
(d) Quantitative
Answer:
(a) Secondary
11. If the standard deviation is high, then it indicates:
(a) The scores are consistent
(b) The scores are scattered more
(c) The scores are scattered less
(d) The scores are constant
Answer:
(b) The scores are scattered more
12. By taking the ………. standard deviation can be derived deviation.
(a) Quotient
(b) Sum
(c) Square root
(d) Area
Answer:
(c) Square root
13. There are ………. basic components in time series.
(a) 2
(b) 4
(c) 3
(d) 5
Answer:
(b) 4
![]()
14. ……….. are useful to study the trend of business and economic variable.
(a) Mean
(b) Median
(c) Standard deviation
(d) Index number
Answer:
(d) Index number