Tamilnadu State Board New Syllabus Samacheer Kalvi 12th Business Maths Guide Pdf Chapter 9 Applied Statistics Miscellaneous Problems Text Book Back Questions and Answers, Notes.
Tamilnadu Samacheer Kalvi 12th Business Maths Solutions Chapter 9 Applied Statistics Miscellaneous Problems
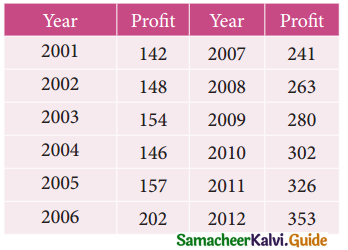
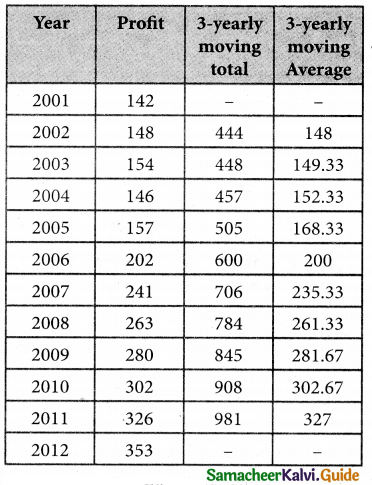
Question 1.
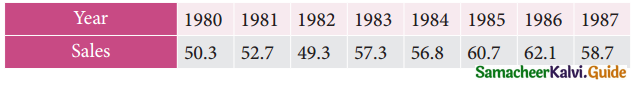
Using three yearly moving averages, Determine the trend values from the following data.
Solution:
![]()
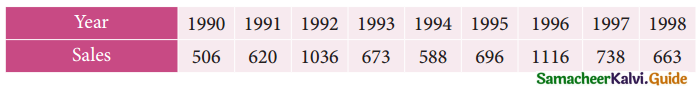
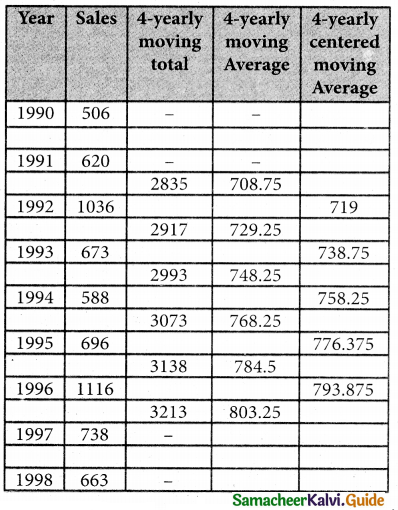
Question 2.
From the following data, calculate the trend values using fourly moving averages.
Solution:
Question 3.
Fit a straight line trend by the method of least squares to the following data.
Solution:
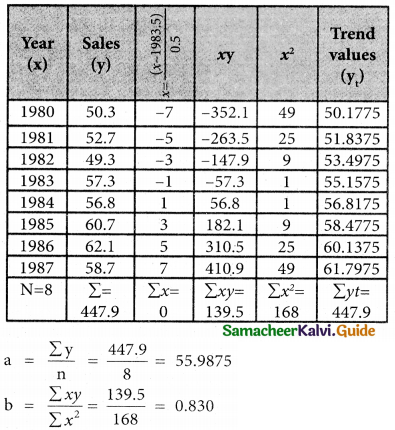
Therefore, the required equation of the straight line trend is given by
y = a + bx
y = 55.9875 + 0.830 x
⇒ y = 55.9875 + 0.83 (\(\frac { x-1983.5 }{0.5}\))
The trend values can be obtained by
When x = 1980
y = 55.9875 + 0.83 (\(\frac { 1980-1983.5 }{0.5}\))
= 55.9875 + 0.83 (-7)
= 55.9875 – 5.81
= 50.1775
When x = 1981
y = 55.9875 + 0.83 (\(\frac { 1981-1983.5 }{0.5}\))
= 55.9875 + 0.83 (-5)
= 55.9875 – 4.15
= 51.8375
When x = 1982
y = 55.9875 + 0.83 (\(\frac { 1981-1983.5 }{0.5}\))
= 55.9875 + 0.83 (-3)
= 55.9875 – 2.49
= 53.4975
When x = 1983
y = 55.9875 + 0.83 (\(\frac { 1983-1983.5 }{0.5}\))
= 55.9875 + 0.83 (-1)
= 55.9875 – 0.83
= 55.1575
When x = 1984
y = 55.9875 + 0.83 (\(\frac { 1984-1983.5 }{0.5}\))
55.9875 + 0.83 (1)
= 56.8175
when x = 1985
y = 55.9875 + 0.83 (\(\frac { 1985-1983.5 }{0.5}\))
= 55.9875 + 0.83 (3)
= 55.9875 + 2.49
= 58.4775
when x = 1986
y = 55.9875 + 0.83 (\(\frac { 1986-1983.5 }{0.5}\))
= 55.9875 + 0.83 (5)
= 55.9875 + 4.15
= 60.1375
when x = 1987
y = 55.9875 + 0.83 (\(\frac { 1987-1983.5 }{0.5}\))
= 55.9875 + 0.83 (7)
= 55.9875 + 5.81
= 61.7975
![]()
Question 4.
Fit a straight line trend by the method of least squares to the following data.
Solution:
Lasperyre’s price Index number
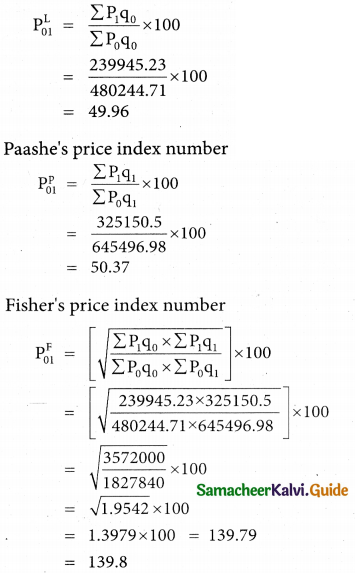
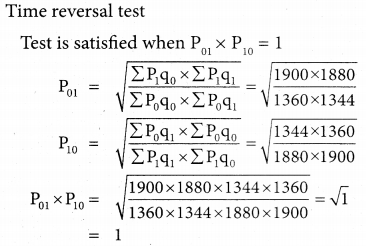
Hence Fisher’s Ideal Index satisfies Time reversal test
![]()
Question 5.
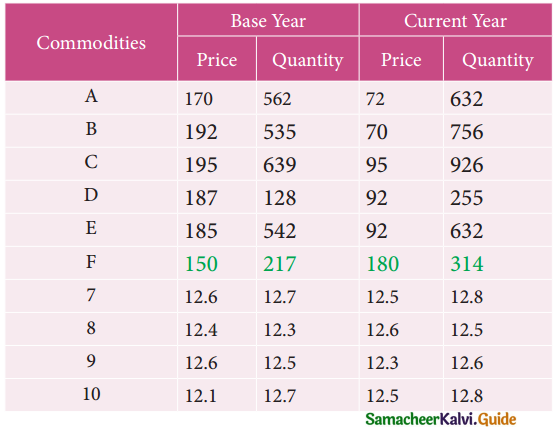
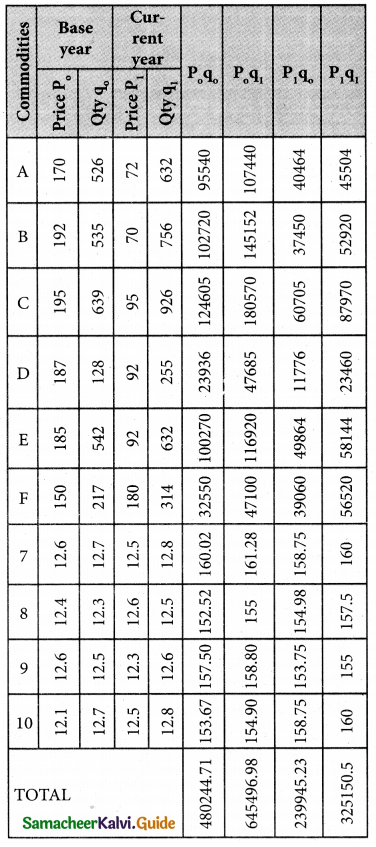
Using the following data, construct Fisher’s Ideal Index Number and Show that it satisfies Factor Reversal Test and Time Reversal Test?
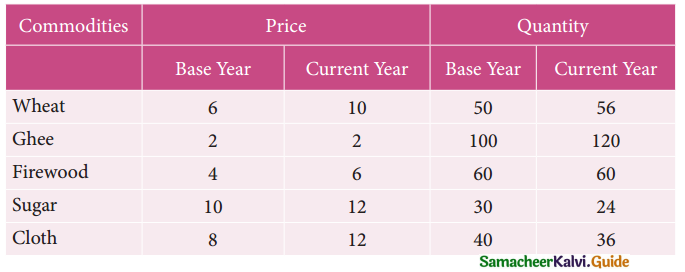
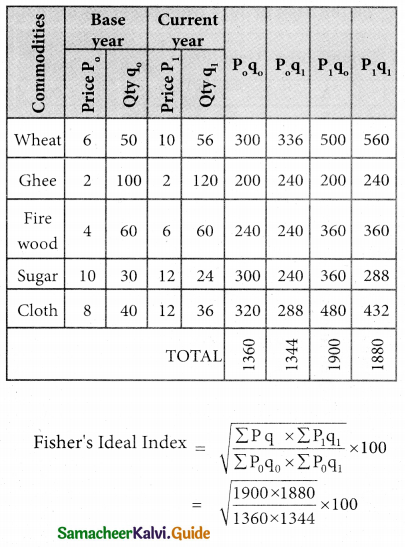
Solution:
Factor reversal test
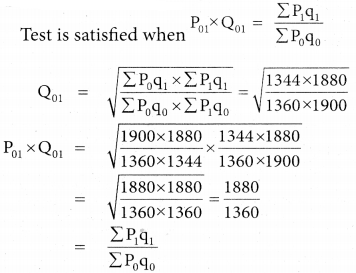
Hence Fisher’s Ideal Index satisfies Factor reversal test.
Question 6.
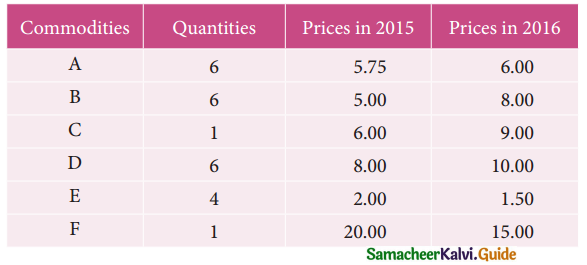
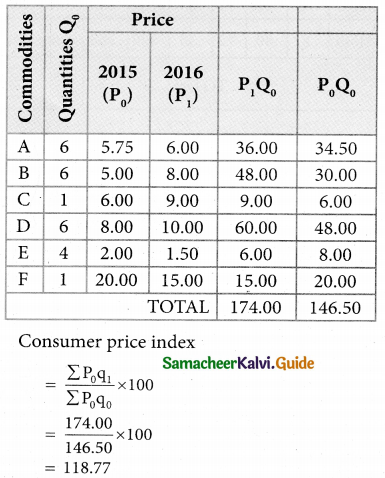
Compute the consumer price index for 2015 on the basis of 2014 from the following data.
Solution:
![]()
Question 7.
An Enquiry was made into the budgets of the middle class families in a city gave the following information.
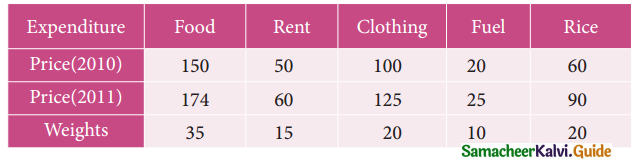
What changes in the cost of living have taken place in the middle class families of a city?
Solution:
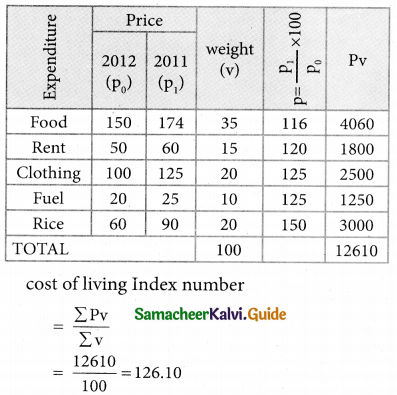
Conclusion:
The cost of living has increased up to 26.10% in 2011 as compared to 2010.
Question 8.
From the following data, calculate the control limits for the mean and range chart.
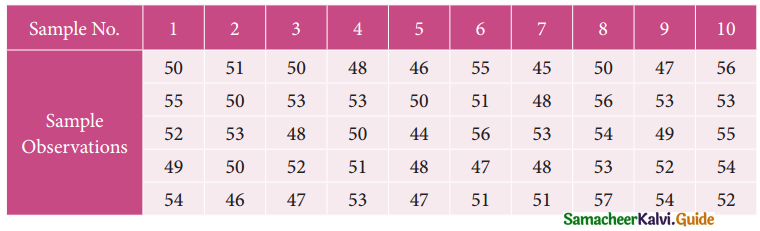
Solution:
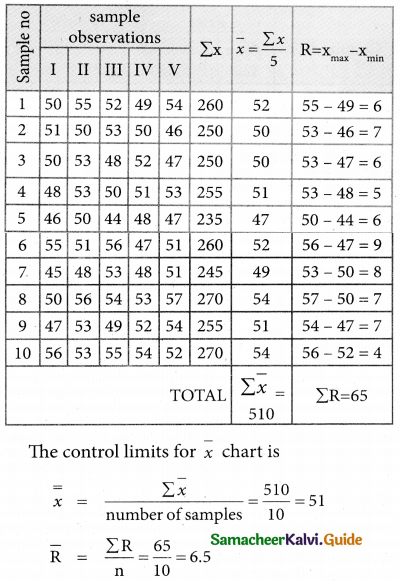
UCL = \(\bar { \bar x}\) + A2\(\bar { R}\)
= 51 + 0.577(6.5)
= 51 + 3.7505
= 54.7505
= 54.75
CL = \(\bar { \bar x}\) = 51
UCL = \(\bar { \bar x}\) – A2\(\bar { R}\)
= 51 – 0.577(6.5)
= 51 – 3.7505
= 47.2495
= 47.25
The control limits for Range chart is
UCL = D4\(\bar { R}\)
= 2.114(6.5)
= 13.741
CL = \(\bar { R}\) = 6.5
LCL = D3\(\bar { R}\) = 0(6.5) = 0
![]()
Question 9.
The following data gives the average life(in hours) and range of 12 samples of 5 lamps each. The data are
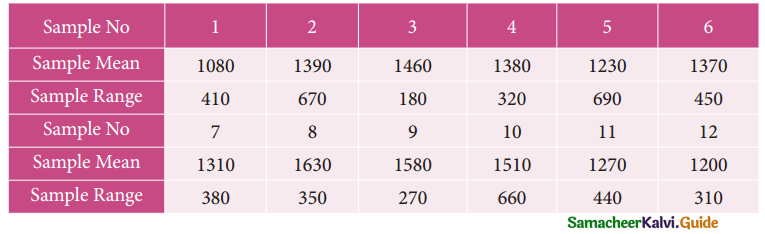
Construct control charts for mean and range Comment on the control limits.
Solution:
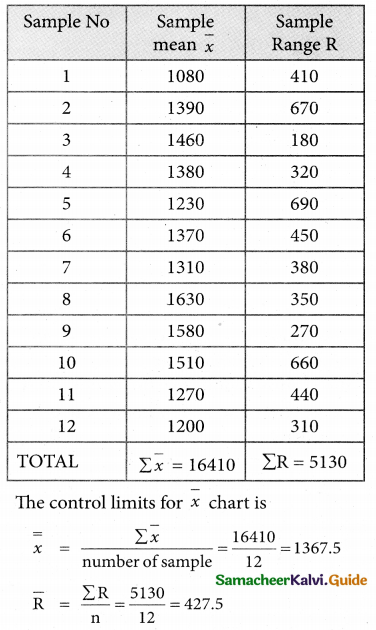
UCL = \(\bar { \bar x}\) + A2\(\bar { R}\)
= 1367.5 + 0.577(427.5)
= 1367.5 + 246.6675
= 1614.1675
= 1614.17
CL = \(\bar { \bar x}\) = 1367.5
LCL = \(\bar { \bar x}\) + A2\(\bar { R}\)
= 1367.5 – 0.577(427.5)
= 1367.5 – 246.6675
= 1120.8325
= 1120.83
The control limits for Range chart is
UCL = D4\(\bar { R}\)
= 2.115(427.5)
= 904.1625
= 904.16
CL = \(\bar { R}\) = 427.5
LCL = D3\(\bar { R}\)
= 0(427.5)
= 0
Question 10.
The following are the sample means and I ranges for 10 samples, each of size 5. Calculate ; the control limits for the mean chart and range chart and state whether the process is in control or not.
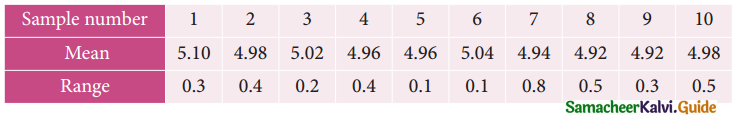
Solution:
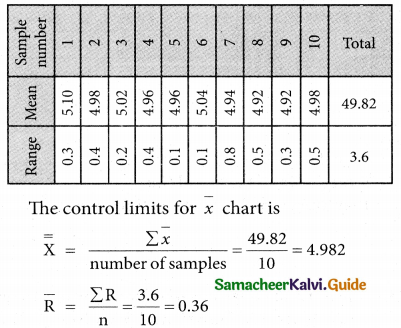
UCL = \(\bar { \bar x}\) + A2\(\bar { R}\)
= 4.982 + 0.577(0.36)
= 4.982 + 0.20772
= 5.18972
= 5.19
CL = \(\bar { \bar x}\) = 4.982
LCL = \(\bar { \bar x}\) + A2\(\bar { R}\)
= 4.982 – 0.577(0.36)
= 4.982 – 0.20772
= 4.77428
= 4.774
The control limits for range chart is
UCL = D2\(\bar { R}\) = 2.115(3.6)
= 7.614
CL = \(\bar { R}\) = 3.6
LCL = D3\(\bar { R}\)
= 0(0.36) = 0
![]()